| Location | pink Admix prop +/- 2 SE (n) | white Admix prop +/- 2 SE (n) |
|---|---|---|
| SR | 0.007 +/- 0.000 (46) | 0.007 +/- 0.000 (37) |
| S22 | 0.033 +/- 0.009 (19) | 0.013 +/- 0.010 (10) |
| SM | 0.019 +/- 0.003 (18) | 0.006 +/- 0.001 (28) |
| S6 | 0.029 +/- 0.005 (22) | NA |
• 12. Observational studies
Motivating Scenario:
You cannot do an experiment, but you really want to rigorously learn from observations.
Learning Goals: By the end of this chapter, you should be able to:
- Explain why observational studies need to (and can) be designed just as carefully as experiments.
- Make meaningful comparisons in an observational study.
- Explain how triangulating multiple lines of evidence can be used to dig into a claim from an observational study.
- Report observational findings honestly.
I just wrote a bunch about the magic of experiments. By randomly assigning a manipulation of the thing we care about, experiments are the way to learn about causation etc. etc. Why then am I even introducing the idea of conducting observational studies? In my view there are two clear answers:
- I give zero shits about what happens in test tubes, petri dishes or greenhouses, I care about understanding the real world. By design, experiments are highly controlled and isolate a small number of potential explanatory variables. But the world is complex, with a bunch of stuff happening at the same time. While an experiment can tell us about cause – in my view at least – experimental evidence makes a claim about the world plausible; it does not make it correct. So while we should worry about external and ecological viability in our study design, to me, the proof is in the pudding, and the pudding is in the natural world.
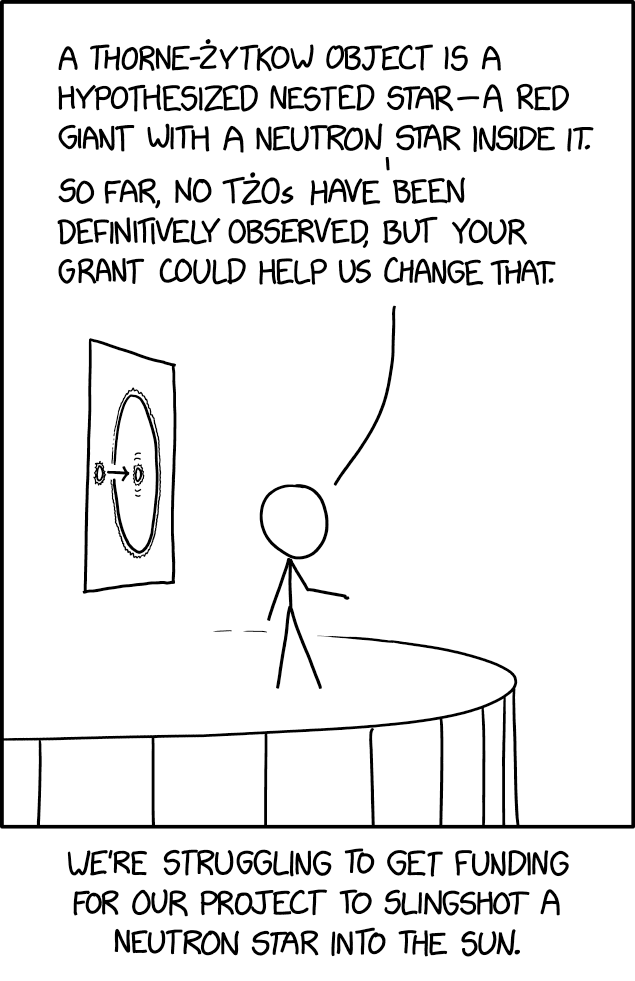
- Sometimes experiments are unethical, impractical, too expensive, or biologically impossible. I study evolution, and do not own a DeLorean required for time travel, and set up and replicate a bunch of experiments on alternative worlds. So, the best I can do is make sense of the world we see. Similarly, if we want to know if vaping is bad for you I can’t make some people vape and others not vape – that’s unethical, etc. So we often are forced to make decisions from observational data.
So, we want to learn things from patterns in nature, but nature contains covariates, patterns that can play into our own cognitive biases and the like – all things that challenge such inference. How can we conduct meaningful observational studies? That is the question we explore in this section, and return to in our discussion of causal inference later.
NOTE: I hope point one isn’t too dismissive. I love experiments, and believe they are magic and an important part of understanding the world. But, they are a part of understanding the world, not the whole of it.
Designing an observational study
Because observational studies are simply “not experiments,” there is a great diversity of the types of observational studies we can do. But all observational studies have one thing in common that is easy to overlook – they are designed. An observational study is not just a thing we noticed, but a structured approach to learning from the world, following a systematic plan. So the design of observational studies needs to be considered as deeply as the design of experimental studies.
Luckily, we are already familiar with best practices in designing observational studies, because we basically are just importing ideas from experimental design! Here are some tips:
Choose comparison groups thoughtfully
Don’t just look at two groups and compare means, think hard about potential confounds and make fair comparisons. That is, consider the placement of individuals into “control” and “treatment” groups as a design decision, rather than a fixed feature of the world.
Stratify
For example, one useful strategy is to stratify observations. That is, we compare within a suspected confounder’s levels – much like we try to do with blocking in experimental design. So, for example, if we want to see whether pink petals and hybridity are associated, we learn more from comparing the admixture proportion of white- and pink-flowered parviflora at sites SM and SR, where both floral phenotypes exist, than from relying on comparisons that include S6, where there are no white flowers at all (because a lot of things could influence admixture proportion across field sites).
Match
In an observational study, we cannot randomly assign petal area to flowers, but (as noted above) we can choose the comparisons to make. One useful strategy is to match pairs of individuals who are the same in every possible way except the thing we want to know about.
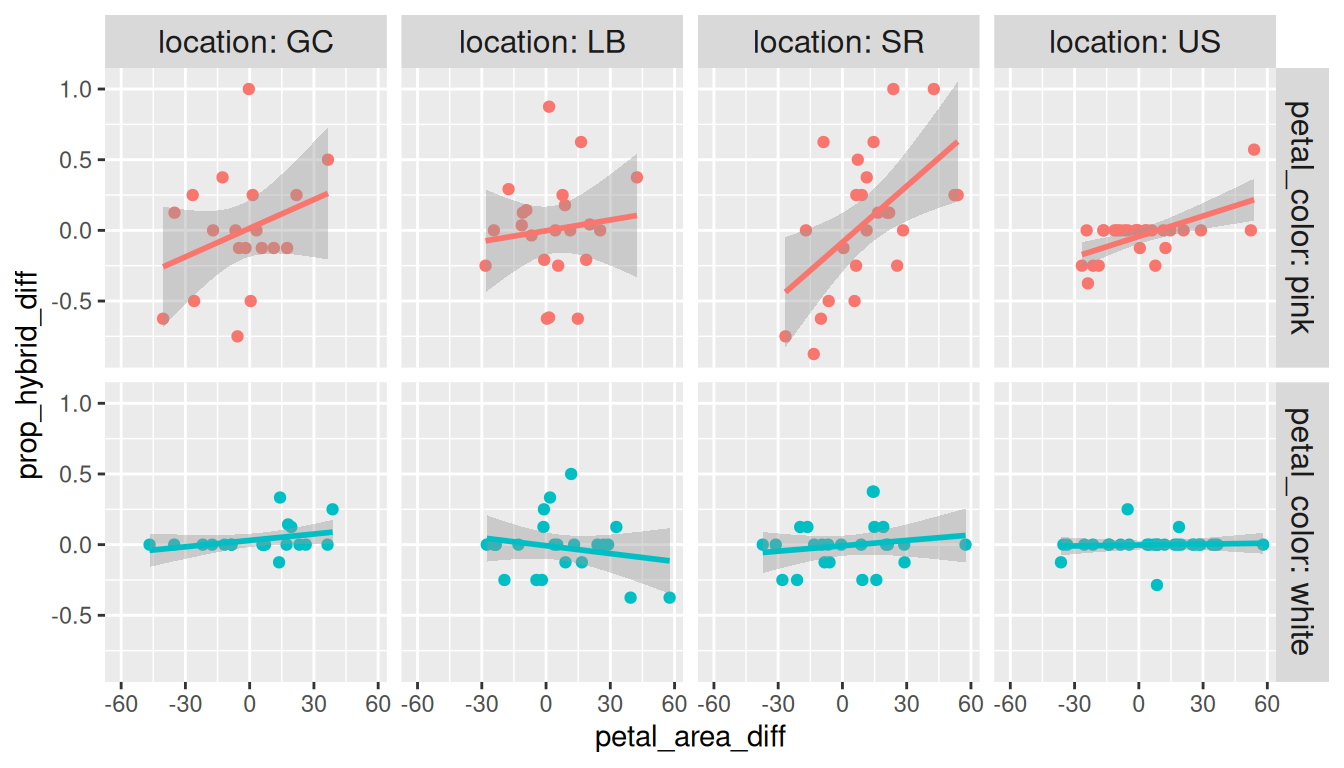
For example, let’s return to the question of whether parviflora RILs with larger petals have more hybrid seeds. If you recall, we found that they did, but these plants also had greater anther stigma distance, so we couldn’t know if the observation was attributable to petal area or anther stigma distance. The plot below tries to answer this question by implementing the following matching technique:
- I matched RILs by petal color (white or pink).
- I then matched RILs on anther-stigma distance. That is: for each petal color, I found pairs of RILs with the closest value of anther stigma distance.
- I then found the difference in anther stigma distance, petal area, and proportion hybrid seeds.
- I then checked for residual confounding. That is, I tested to ensure that this matching did not incidentally generate an association between difference in petal area and difference in anther stigma distance.
- I then examined the association between the difference in petal area and the difference in the proportion hybrid across field sites and petal colors (Figure 1).
Figure 1 shows that – among pairs matched on anther-stigma distance – across all field sites, pink-petaled RILs with larger petals had a greater proportion of hybrid seeds, but that no such pattern was observed in white-petaled RILs.
The code to pull off this matching was somewhat involved. But luckily LLMs like Gemini, Claude, and ChatGPT can do this relatively easily. Just remember that if you have one of these LLMs do this work for you, you must check the results to make sure the steps worked correctly.
Look for “natural experiments”
Technologies are often rolled out at different times at different places. Laws can sometimes change at a very granular geographic scale (e.g. Moorhead, MN vs. Fargo, ND; Lakeland, MN vs. Hudson, WI; Duluth, MN vs. Superior, WI). Similarly, some decisions (e.g. school placement, etc) can be decided by a lottery. We can make the most of such “natural experiments” to ask questions when an artificial experiment is not possible. While our Clarkia studies have not benefited from a “natural experiment” they can be quite valuable when they present themselves.
Sample systematically, not conveniently
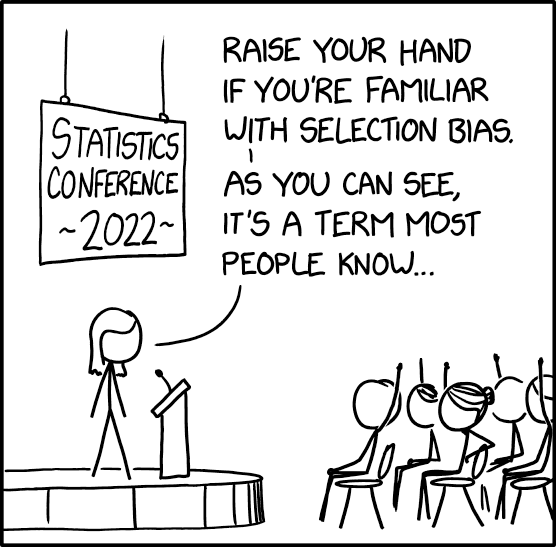
Formal observational studies can be inspired by informal observations. But when conducting an observational study we must ensure that we are systematically investigating, not “noticing.” Thus be sure to follow best practices in sampling presented in the sampling better of Chapter 8:
- Define your target population first
- Sample from the population randomly or systematically, rather than reaching for whatever is easiest to find.
Please revisit the section in Chapter 8 about sampling bias for a refresher on what can go wrong with sampling.
If you can’t tell, I love this stuff! I hope this wasn’t too much. We will dig deeper into this material later in the book when we discuss formal causal inference methods in more detail.
Making inference from observational studies
If an observational study finds that two variables are associated, we should ask:
- Could the explanatory variable cause the response?
- Could the response cause the explanatory variable?
- What other covariates / alternative explanations are plausible, and can we address them?
- Could this pattern have arisen by chance alone – a false positive?
- Is there a plausible causal mechanism that would generate data like we see under our preferred hypothesis? How about under some alternative explanations? Do they make distinguishing predictions?
After reflecting on these questions, you are ready to take the next steps.
Triangulate evidence to make strong claims
Contrary to what you see in movies, scientific discovery rarely comes from one heroic experiment or observation. Rather, we make scientific progress by synthesizing different forms of evidence. So, observational studies can complement experimental results, and generate novel predictions, so that we can triangulate towards the right answer.
Below, I work through how we can triangulate lines of evidence to try to learn the direction of causation. Of course, we can combine evidence to differentiate between other types of competing causal models.
Triangulation: Does introgression cause pink flowers, or vice versa?
For example, our observational study of natural hybrid zones (Sianta et al. (2026)) found that white-petaled parviflora plants had less xantiana ancestry than pink-petaled parviflora plants. We noted two potential explanations for this observation:
Pink causes introgression. Pink-petaled plants likely came from pink-petaled parents, grandparents, and so on, who were themselves more likely to receive pollen from xantiana. Thus, a lineage of pink flowers could accumulate more xantiana ancestry over generations simply because pink flowers attract pollinators that will bring xantiana pollen.
Introgression causes pink. Parviflora plants have either pink or white petals, but all xantiana plants have pink petals. So a parviflora plant could be pink not because pink attracts more hybridization, but because it inherited the pink-petal allele itself from a xantiana ancestor sometime in its lineage’s history.
How can we tell these apart? Our RIL result – where pink RILs also had a higher proportion of hybrid seeds – is at least consistent with pink causing introgression. We can also think through this and make a prediction that helps distinguish between the two explanations: if introgression causes pink, we should find that the locus underlying pink petals, in hybridizing parviflora populations, traces back to a xantiana ancestor. Testing this would take additional effort (mapping the pink locus and tracing its ancestry in these populations, etc.) but science requires work.
Honesty is the best policy
When interpreting your results, you should aim more towards being honest than making a strong case. This honesty should start with being honest with yourself, by deeply considering the questions above. Consider this classic advice:
“But this long history of learning how to not fool ourselves—of having utter scientific integrity—is, I’m sorry to say, something that we haven’t specifically included in any particular course that I know of. We just hope you’ve caught on by osmosis. The first principle is that you must not fool yourself—and you are the easiest person to fool.”
Once you have completed this deep thought, you are ready to communicate your results. Again, hiding inconvenient truths about confounds that are unresolved, or alternative explanations that were not explored weakens both your argument and your credibility. Be upfront.
That said, you need not hem and haw ambivalently forever. As you understand the story, tell it with the supporting facts that lead you to your conclusion, and the necessary caveats that remain.