
1. Getting started with R
Motivating scenario: You have heard about R and RStudio, and may have used them, but want a foundation so you can know what is going on as you do more and more with it.
Learning goals: By the end of this chapter you should be able to
- Explain why we are using R and RStudio.
- Create vectors, perform calculations, ask logical questions, and assign variables in R.
- Use R functions, and understand what a function is.
- Install R packages.
- Load data into R, view it, and find the types of variables in each column.
- Know your way around RStudio.
By the end of this introductory section, you should be able to
- Navigate the RStudio Console and run code by typing a command and pressing Enter/Return.
- Use R as a calculator, including basic arithmetic and exponents (e.g.,
+,*,^). - Ask logical questions in R using comparison operators.
- Add comments to code using
#to leave notes that R will not interpret.

- Describe and visualize data,
- Test null hypotheses,
- Develop complex models, and
- Share our workflow so that our work can be reproduced, reevaluated, questioned, and improved.
What is R? What is RStudio?
R is a computer program built for data analysis. As opposed to GUIs, like Excel, or click-based stats programs, R is focused on writing and sharing scripts. Writing analyses as R scripts allows us to share them and reproduce exactly what we did. R has become the computer language of choice for most statistical work because it’s free, allows for reproducible analyses, makes great figures, and has many “packages” that support the integration of novel statistical approaches. In a recent paper, we used R to analyze hundreds of Clarkia genomes and learn about the history of speciation and gene flow in this group (Figure 1 from Sianta et al. (2024)).
RStudio is a user-friendly interface that makes it easier to get the most out of R. “More precisely, R is a programming language that runs computations, while RStudio… provides an interface by adding many convenient features and tools.” Ismay & Kim (2019).
The Shortest Introduction to R
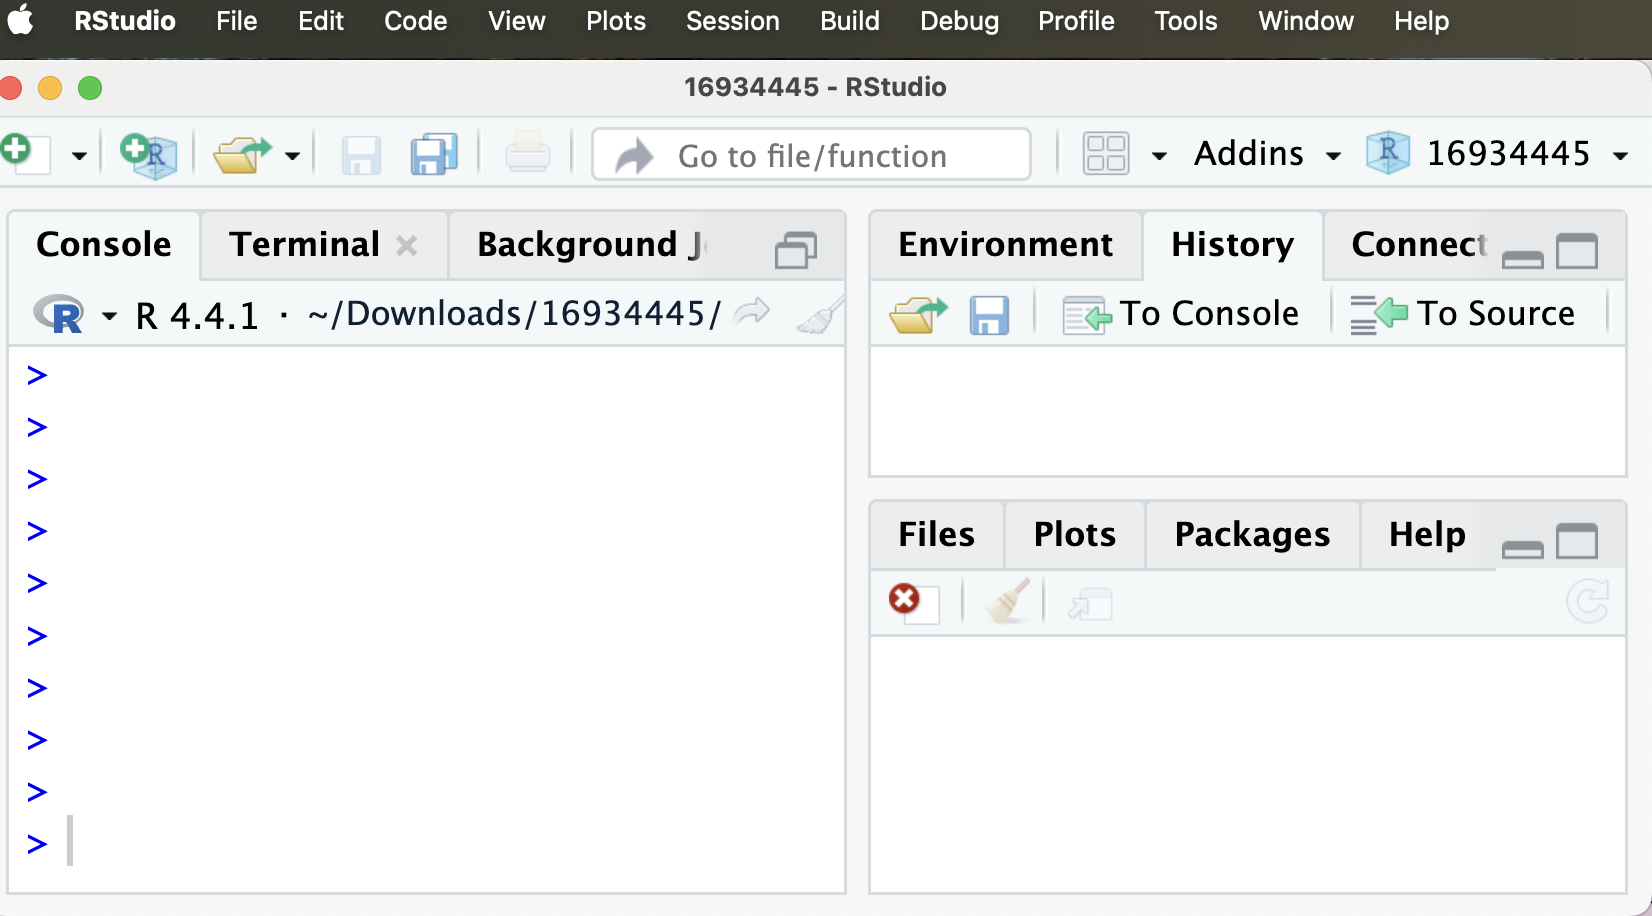
Let’s open RStudio to get familiar with it. Figure 3 displays a fresh RStudio session. The two panels on the right, which we will ignore for now – are empty. The panel on the left, known as the “RStudio console” is also empty, save the > sign, which shows that it is ready for an R command. This is where we will first interface with R.
R can perform simple (or complex) calculations. For example, entering 1 + 1 returns 2, and entering 2^3 (two raised to the power of three) returns 8. Below, however, we see that typing 1 + 1 returns nothing (Figure 4).
Math in R: See posit's recipe for using R as a calculator for more detail.
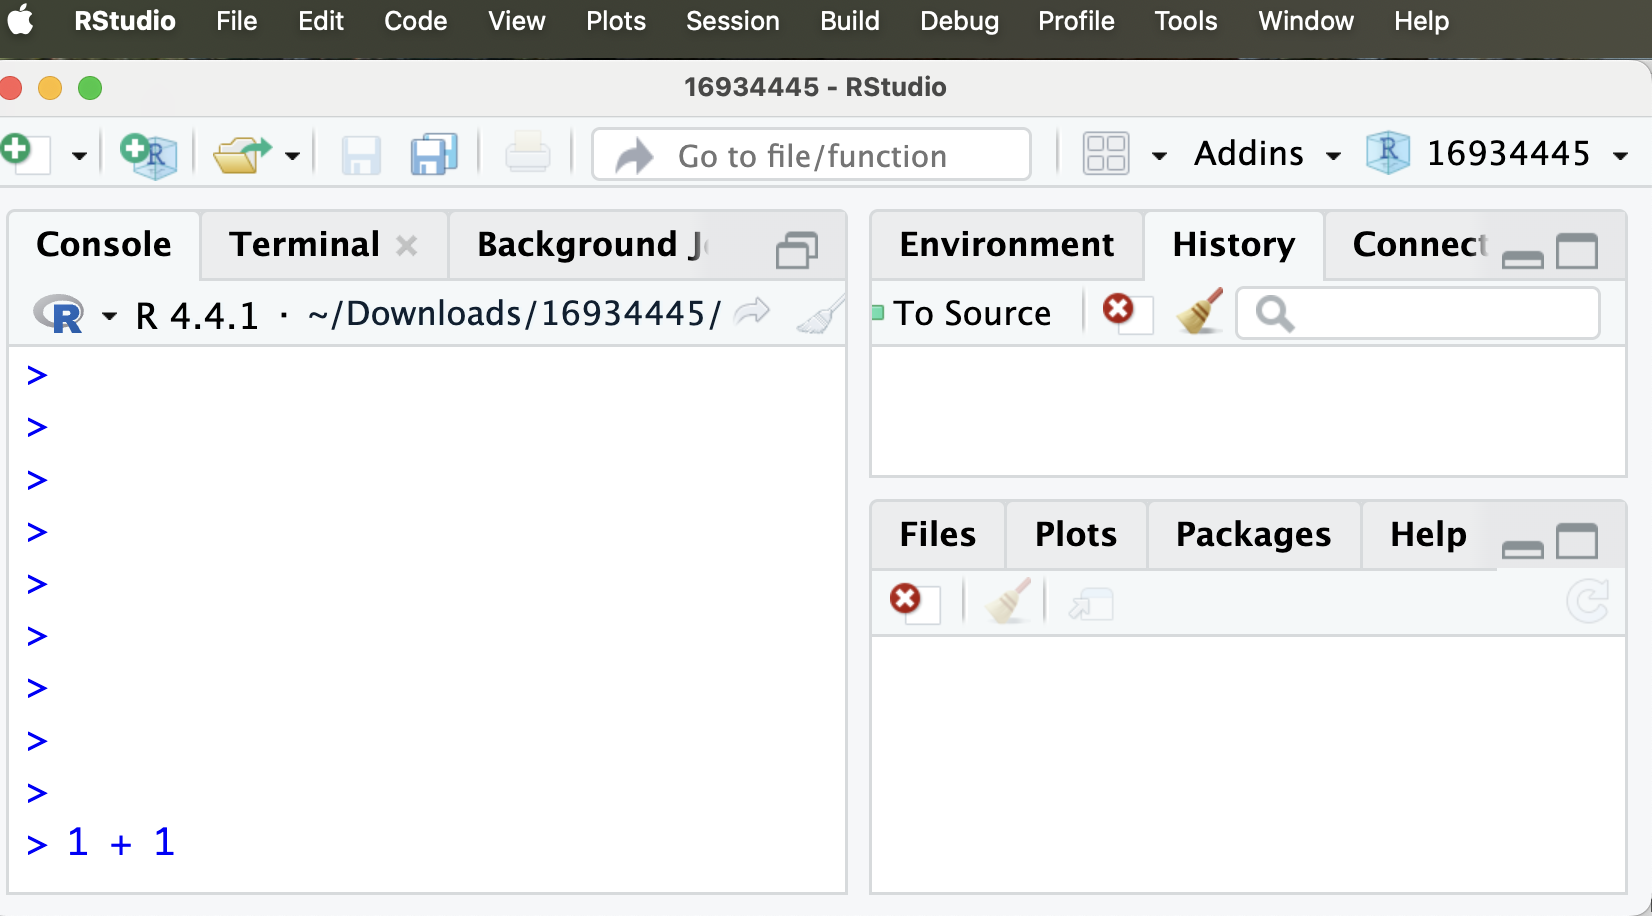
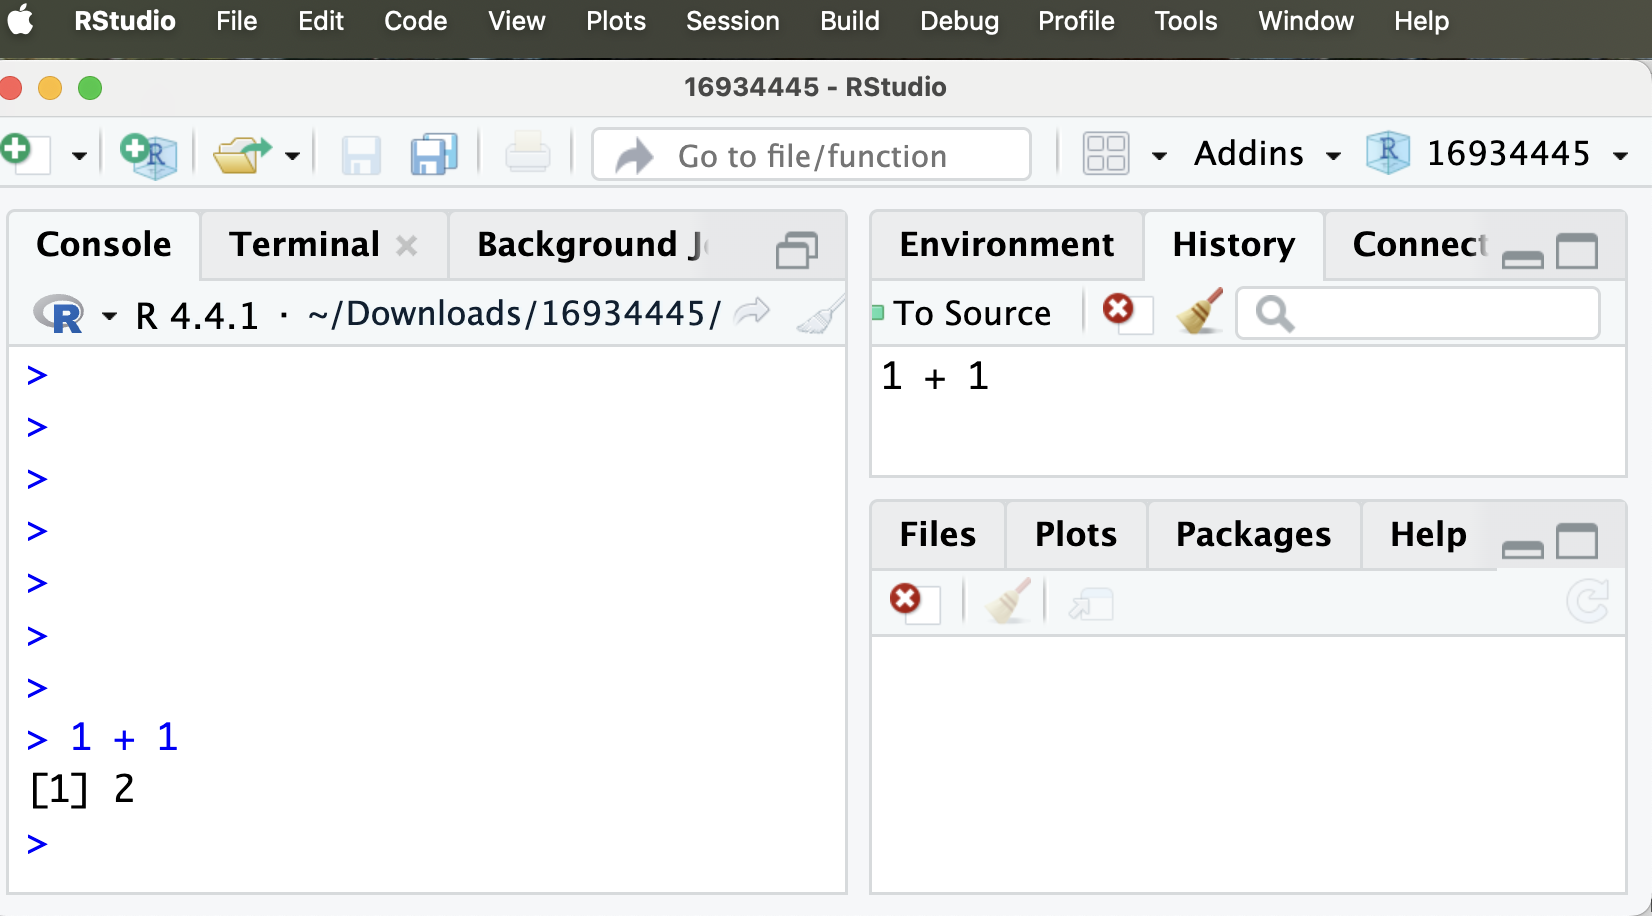
R did not do anything in Figure 4 because we did not tell R to add 1 + 1. Rather, we prepared to tell R to do this. By pressing the Return key, we tell R to do as we ask, and it returns the answer, 2 (Figure 5).
Note that
Ractually returns[1] 2. We will discuss what this means in the next section, but for now, ignore the[1]bit.You can also see that the history pane (top right) now says
1 + 1. This pane records a history of all of our code in this R session.
Asking logical questions
We often want to ask basic questions of our data - for example if two values are equal to one another or if one is greater than another. Later, we will see that these questions can be quite helpful when sorting through and filtering our data.
The table below introduces the standard ways we can ask such logical questions. Each such question returns either TRUE or FALSE.
Use two equal signs to ask if something is equal to something else. A common mistake is to simply use one equal sign. Don’t make this mistake. Compare the code and output below:
2 * 3 == 6 # Right way[1] TRUE2 * 3 = 6 # Wrong way Error in `2 * 3 = 6`:
! target of assignment expands to non-language object| Question | R Syntax |
|---|---|
| Does a equal b? | a == b |
| Does a not equal b? | a != b |
| Is a greater than b? | a > b |
| Is a less than b? | a < b |
| Is a greater than or equal to b? | a >= b |
| Is a less than or equal to b? | a <= b |
Your turn!
Now try it yourself! To make your life easy, I provide a mini R console below, but you can try it on your own R console if you prefer.
Commenting code The hash, #, tells R to stop reading your code. This allows you to “comment” your code – keeping notes to yourself and other readers about what the code is doing. Commenting your code is very valuable and you should do it often!Commenting code The hash, #, tells R to stop reading your code. This allows you to “comment” your code – keeping notes to yourself and other readers about what the code is doing. Commenting your code is very valuable and you should do it often!