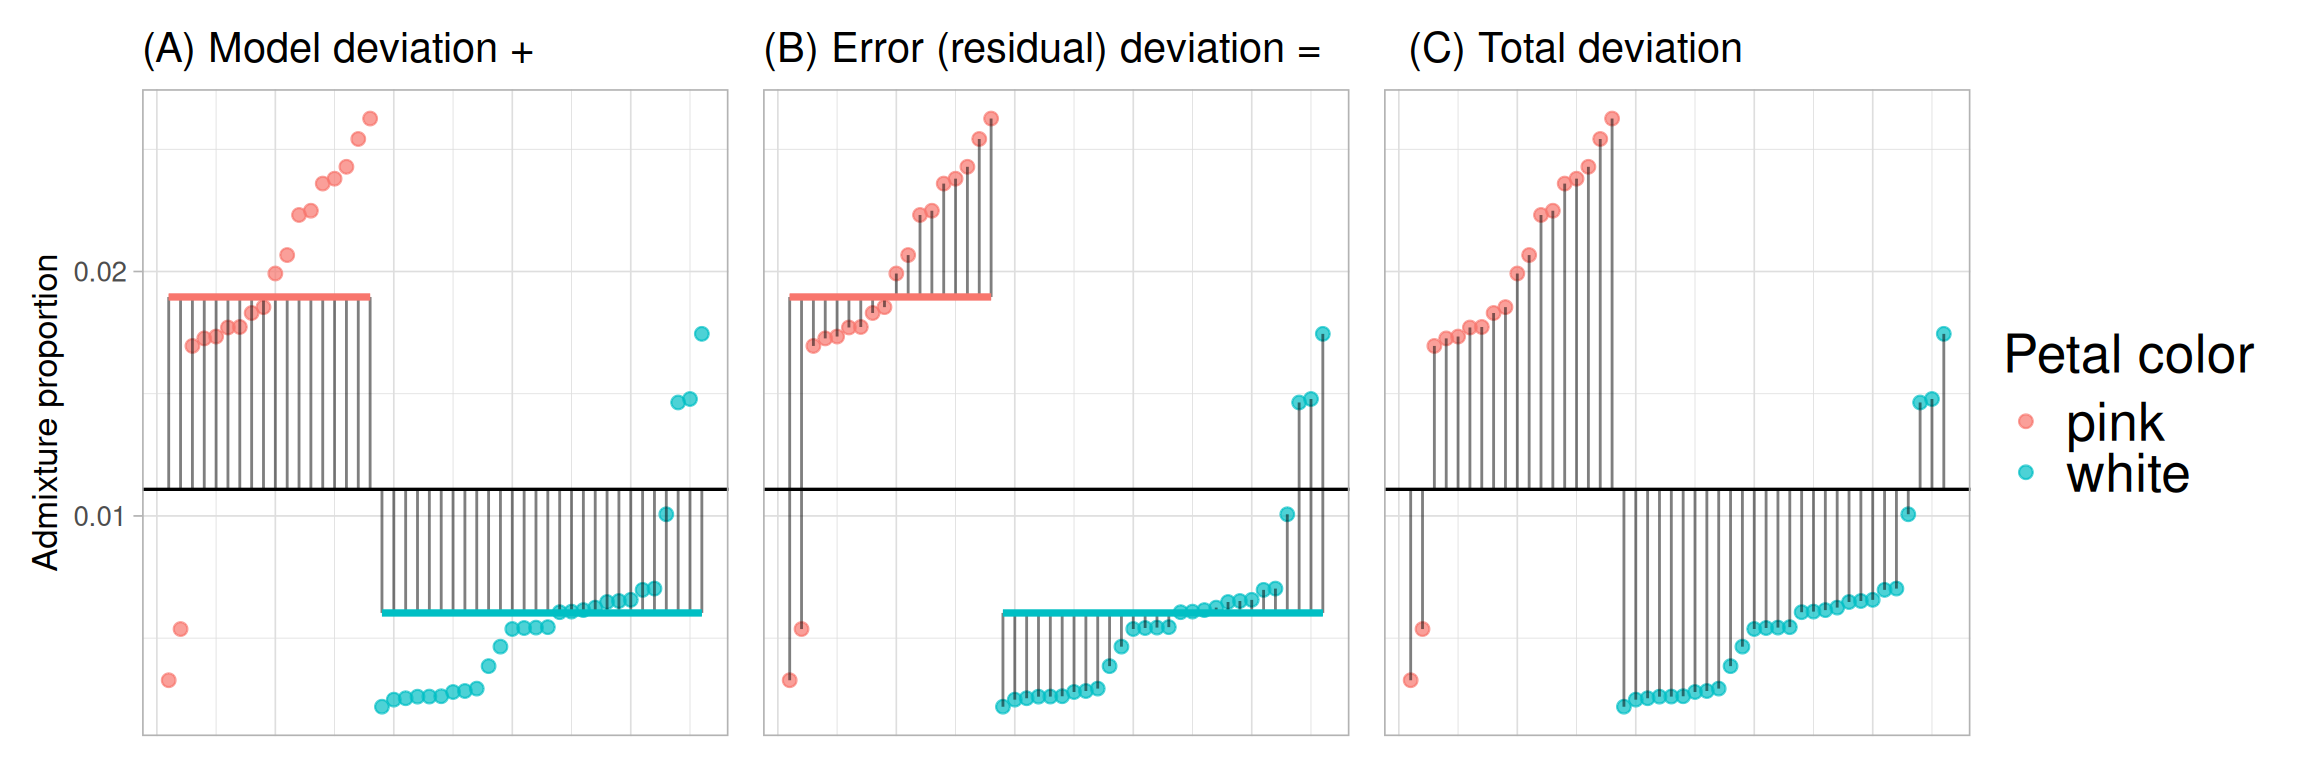
library(broom)
library(patchwork)
library(tidyverse)


# ---- Load & prepare data ----
hz_link <- "https://raw.githubusercontent.com/ybrandvain/datasets/refs/heads/master/zones_df_admix_weight_cutoff0.9_gps_dist2het_phenos_excl_GC.csv"
clarkia_hz <- read_csv(hz_link)|>
  select(-weighted)|>
  rename(admix_proportion = `cutoff0.9`) |>
  filter(!is.na(admix_proportion))|>
  clean_names() |>
  mutate(site = if_else(site == "SAW", "SR", site)) |>
  filter(subsp=="P")|>
  filter(site == "SM") |>
  mutate(tmp = as.numeric(factor(petal_color)) + admix_proportion,
         id = factor(id),
         id = fct_reorder(id, tmp))

# Fit model
sm_lm <- lm(admix_proportion ~ petal_color, data = clarkia_hz)

# Add augment info
plot_dat <- augment(sm_lm) |>
  mutate(id = row_number(),
         mean_admix = mean(admix_proportion, na.rm = TRUE)) |>
  mutate(tmp = as.numeric(factor(petal_color)) + admix_proportion,
         id = factor(id),
         id = fct_reorder(id, tmp))

# Data for mean lines per group
mean_lines <- plot_dat |>
  group_by(petal_color) |>
  summarise(xstart = min(as.numeric(id)),
            xend   = max(as.numeric(id)),
            mean_val = mean(admix_proportion),
            .groups = "drop")

# --- (C) Total deviation ---
c <- ggplot(plot_dat,
            aes(x = as.numeric(id), y = admix_proportion, color = petal_color)) +
  geom_point(alpha = 0.7, size = 2) +
  geom_hline(aes(yintercept = mean_admix)) +
  labs(title = "  (C) Total deviation",
       color = "Petal color",
       y = "Admixture proportion") +
  geom_segment(aes(xend = as.numeric(id),
                   yend = mean_admix),
               color = "black", alpha = 0.5, linewidth = 0.5) +
  theme_light(base_size = 13) +
  theme(axis.title.x = element_blank(),
        axis.text.x  = element_blank(),
        axis.ticks.x = element_blank())

# --- (A) Model deviation ---
a <- ggplot(plot_dat,
            aes(x = as.numeric(id), y = admix_proportion, color = petal_color)) +
  geom_point(alpha = 0.7, size = 2) +
  geom_hline(aes(yintercept = mean_admix)) +
  # deviation lines
  geom_segment(aes(xend = as.numeric(id), y = .fitted, yend = mean_admix),
               color = "black", alpha = 0.5, linewidth = 0.5) +
  # fitted line
  geom_line(aes(y = .fitted), linewidth = 1.2, show.legend = FALSE) +
  # horizontal group means
  geom_segment(data = mean_lines,
               aes(x = xstart, xend = xend,
                   y = mean_val, yend = mean_val,
                   color = petal_color), show.legend = FALSE,
               linewidth = 1.2, inherit.aes = FALSE) +
  labs(title = "(A) Model deviation +",
       color = "Petal color",
       y = "Admixture proportion")  +
  theme_light(base_size = 13) +
  theme(axis.title.x = element_blank(),
        axis.text.x  = element_blank(),
        axis.ticks.x = element_blank())

# --- (B) Error deviation ---
b <- ggplot(plot_dat,
            aes(x = as.numeric(id), y = admix_proportion, color = petal_color)) +
  geom_point(alpha = 0.7, size = 2) +
  geom_hline(aes(yintercept = mean_admix)) +
  # deviation lines to fitted
  geom_segment(aes(xend = as.numeric(id), yend = .fitted),
               color = "black", alpha = 0.5, linewidth = 0.5) +
  # fitted line
  geom_line(aes(y = .fitted), linewidth = 1.2, show.legend = FALSE) +
  # horizontal group means
  geom_segment(data = mean_lines,
               aes(x = xstart, xend = xend,
                   y = mean_val, yend = mean_val,
                   color = petal_color),
               linewidth = 1.2, inherit.aes = FALSE, show.legend = FALSE) +
  labs(title = "(B) Error (residual) deviation =",
       color = "Petal color",
       y = "Admixture proportion")  +
  theme_light(base_size = 13) +
  theme(axis.title.x = element_blank(),
        axis.text.x  = element_blank(),
        axis.ticks.x = element_blank())


# Combine panels with shared y-axis and legend
(a + b + c) +
  plot_layout(guides = "collect",
              axis_titles = "collect",
              axes = "collect_y") &
  theme(legend.position = "right",
        legend.text = element_text(size = 20),
        legend.title = element_text(size = 20))